
Overview
Laminar is an open-source, OpenTelemetry-native observability platform for the OpenAI Agents SDK (Python, TypeScript). Trace, debug, and monitor every agent turn, tool call, handoff, and sub-agent with a singleLaminar.initialize() call. Self-host via Helm or use managed cloud.
The OpenAI Agents SDK lets you build agent workflows with Agent, Runner.run / run, function tools, and handoffs between specialists. Laminar hooks into the SDK’s built-in trace processor to mirror every agent span into Laminar, plus adds the system instructions so the full prompt is visible in the trace.
What Laminar captures:
- The root agent workflow, each
agents.task, and everyagents.turnwith the model, prompt, response, token counts, latency, and cost. - Every
function_toolinvocation, with arguments and return value. - Handoffs between agents, with the destination agent’s turns nested under the handoff span.
- Agents invoked as tools (
Agent.as_tool/Agent.asTool), with the sub-agent’s full run nested under the tool call. - Sandbox sessions (Python only) started via
SandboxRunConfig, including manifest materialization and shell/file tool calls. - Agent instructions prepended to the input messages on every LLM span.
Getting started
- Python
- TypeScript
1
Install
Ensure you have
lmnr version 0.7.49 or higher:2
Set environment variables
3
Initialize Laminar
Laminar.initialize() auto-instruments the OpenAI Agents SDK when openai-agents is importable. No wrapping call is needed.Wrapping your entry point in
@observe() is optional but recommended: it creates a root span that captures inputs and outputs and makes the trace easy to find in the UI.See what happened in a trace
Open the trace in Laminar and you land on the transcript view: each turn reads as a conversation, with the prompt, the model’s response, and any tool calls inline with their inputs and outputs. A tree of span names tells you the shape of the run; the transcript tells you what actually happened.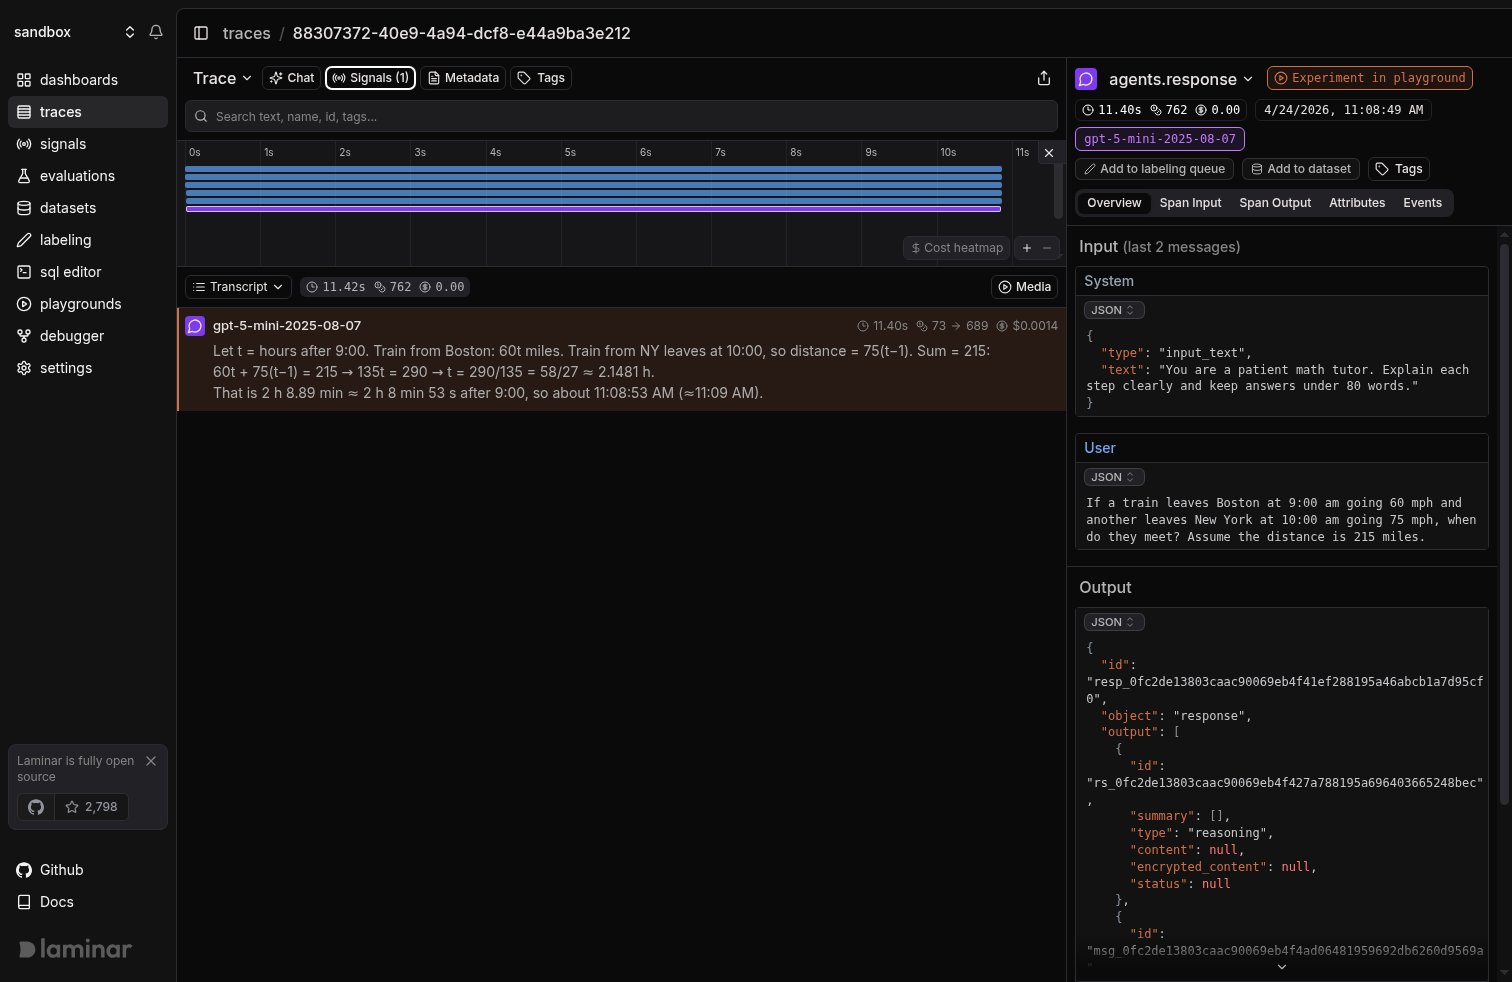
Transcript view of a single-agent run. The agent's system instructions are prepended to the input, the model's full response is shown inline, and token counts and cost are attached to the LLM span.
Multi-agent runs with handoffs
The OpenAI Agents SDK models specialization through handoffs: a triage agent routes the user to a specialist viahandoff(other_agent) / handoff(otherAgent), and the SDK exposes each handoff as a transfer_to_<agent> tool call. In Laminar, the destination agent’s turns and tool calls nest under the handoff span, so you can follow the full multi-agent conversation in one trace.
- Python
- TypeScript
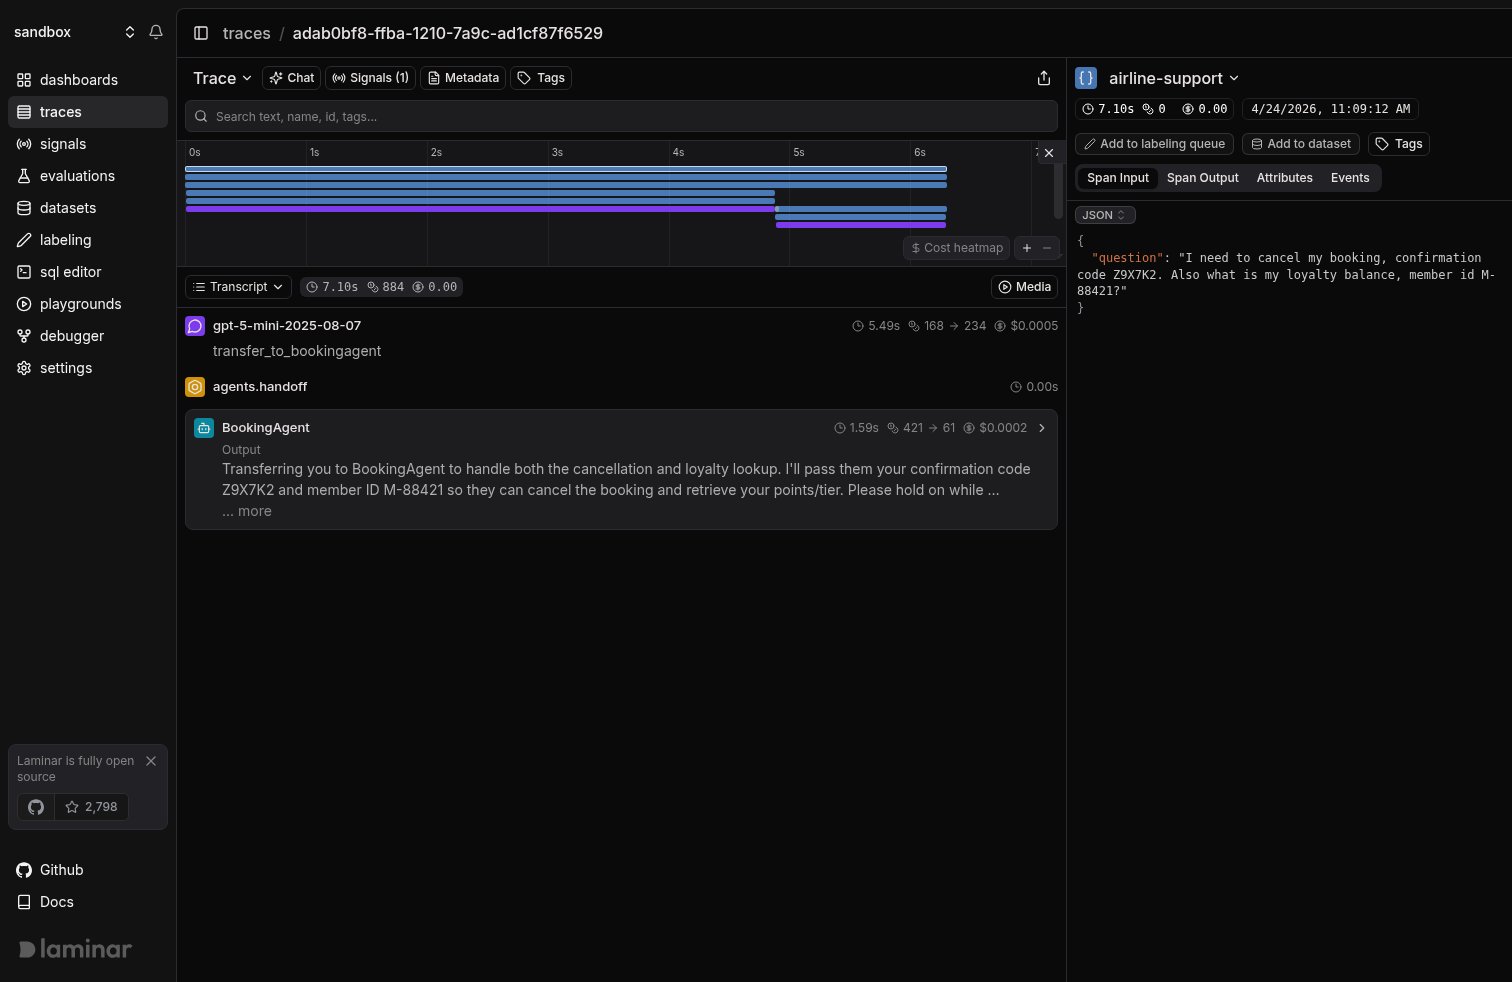
Transcript view of a multi-agent handoff. The first LLM call is the TriageAgent deciding to hand off; the collapsed BookingAgent span shows the sub-agent's final output.
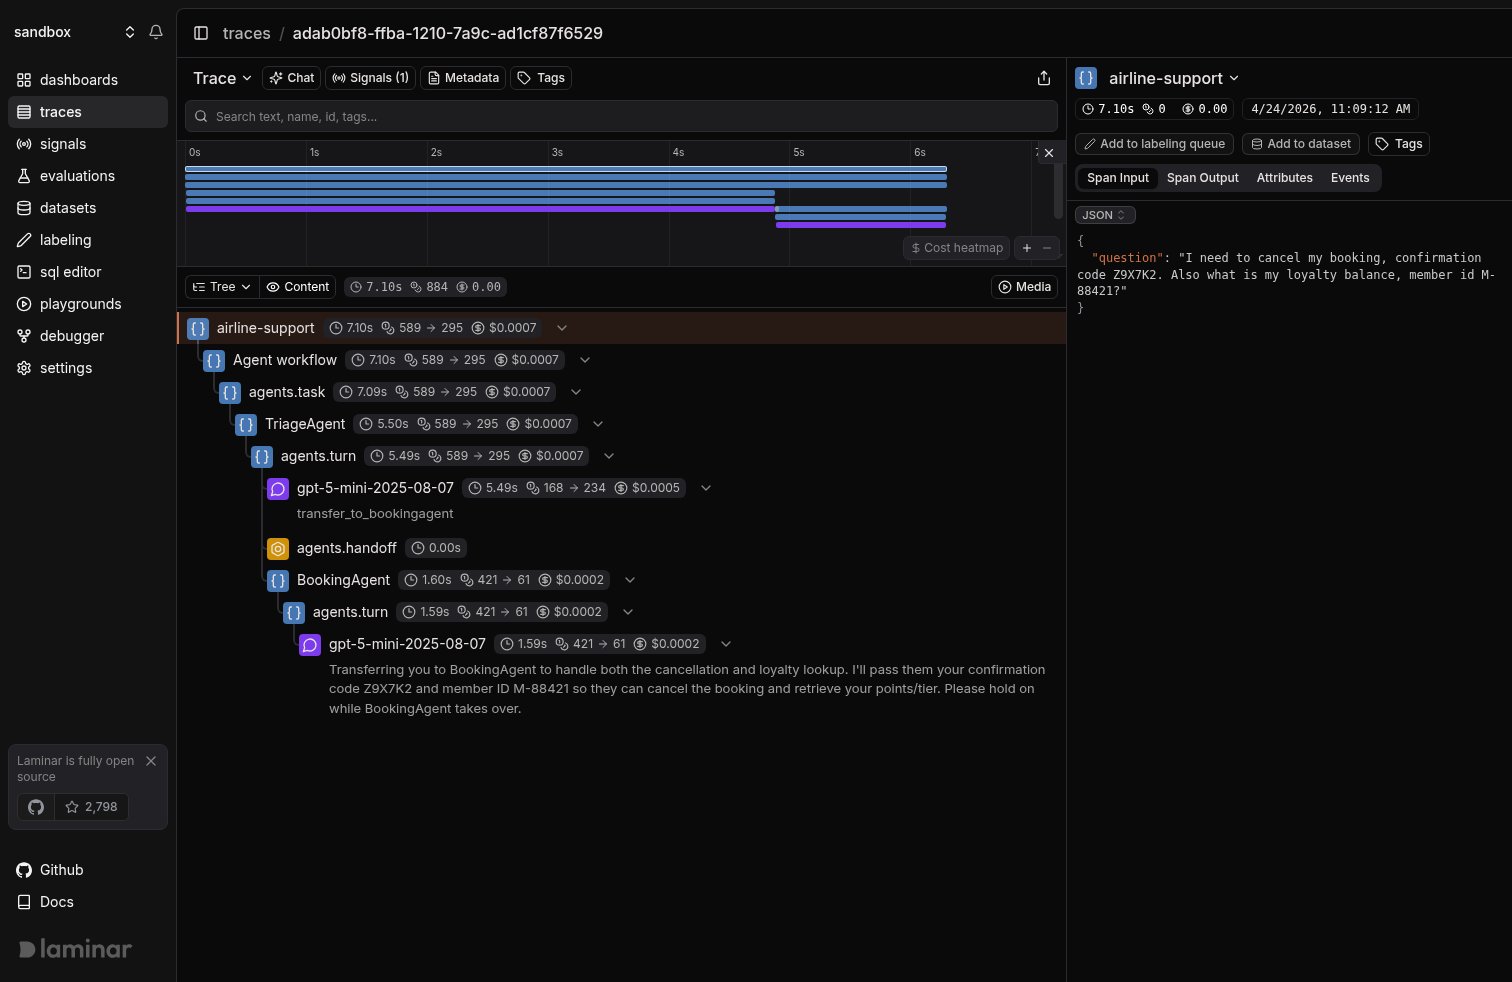
Tree view of the same run: TriageAgent's LLM turn, the agents.handoff span, then BookingAgent with its own turns, cancel_booking, and lookup_loyalty_balance tool spans nested underneath.
Sub-agents as tools
Handoffs transfer the conversation to another agent. Sub-agents as tools keep the orchestrator in control:Agent.as_tool (Python) and Agent.asTool (TypeScript) wrap a specialist as a FunctionTool that the parent agent can call like any other tool, then synthesize the sub-agent’s output back into the parent’s turn. Laminar nests the sub-agent’s full run (its own turns and tool calls) directly under the parent’s tool-call span, so you can read the orchestrator-plus-specialist flow in a single trace.
- Python
- TypeScript
book_flight and write_summary; each call expands into the sub-agent’s own turns, tool calls, and LLM spans, rather than being flattened to a single tool-return value.
Choose between handoffs and sub-agents-as-tools based on who owns the reply: handoffs hand the conversation to the specialist and its answer is returned to the user; sub-agents-as-tools return a structured result back to the orchestrator, which then keeps writing the user-facing response.
Running agents in sandboxes (Python)
The Python SDK can execute an agent against a sandboxed workspace (locally on your machine or on a remote provider like E2B, Modal, Daytona, Runloop, Cloudflare, Vercel, or Blaxel) viaSandboxAgent and SandboxRunConfig. Laminar instruments sandbox sessions and surfaces each manifest materialization step, shell exec, and file read as a span, so you can see exactly what the agent did inside the sandbox alongside the LLM turns that drove it.
Sandboxes are Python-only. The TypeScript SDK does not expose
SandboxAgent / SandboxRunConfig at the time of writing.Local sandbox (UnixLocal)
UnixLocalSandboxClient runs the agent against your host filesystem with no extra infrastructure: a good starting point for development and tests.
Remote sandbox (E2B)
Swap the client for any remote provider to run the same agent on managed infrastructure. The example below uses E2B; the pattern is identical forModalSandboxClient, DaytonaSandboxClient, RunloopSandboxClient, CloudflareSandboxClient, VercelSandboxClient, and BlaxelSandboxClient under agents.extensions.sandbox.<provider>.
sandbox.start / sandbox.cleanup span pair around the agent’s work, the manifest materialization spans that pulled repo into the workspace, and every shell or file operation the agent ran via its sandbox tools.
Track outcomes with Signals
Traces answer what happened on this run. Signals answer the cross-trace question: how often does the triage agent answer a cancellation itself instead of handing off, when do tool calls return errors, how many runs exceed three turns without a final answer. A Signal pairs a plain-language prompt with a JSON output schema. Laminar runs it live on new traces (Triggers) or backfills it across history (Jobs) and records a structured event every time it matches. From there you query, cluster, and alert on events across every trace.Every new project ships with a Failure Detector Signal that categorizes issues on any trace over 1000 tokens. Open it from the Signals sidebar to see events as soon as your agent traces arrive.
Query across traces
- SQL editor for ad-hoc queries across traces, spans, signals, and evals.
- SQL API for programmatic access from scripts and pipelines.
- CLI (
lmnr-cli sql query) for terminal-driven queries and piping JSON into shell tools or coding agents. - MCP server to query Laminar directly from Claude Code, Cursor, Codex, or any MCP-aware client.
Troubleshooting
I don't see any traces in Laminar
I don't see any traces in Laminar
- Confirm
LMNR_PROJECT_API_KEYis set in the same process that runs the SDK. - Python:
openai-agentsmust be importable whenLaminar.initialize()runs. Install withpip install openai-agents. The integration requiresopenai-agents >= 0.7.0andlmnr >= 0.7.49. - TypeScript:
@openai/agentsmust be installed in the same workspace. The integration requires@lmnr-ai/lmnr >= 0.8.21. If you import@openai/agentsbeforeLaminar.initialize()in ESM, pass the module viainstrumentModules: { openAIAgents: agents }.
Handoffs aren't nested under the source agent
Handoffs aren't nested under the source agent
The SDK emits a
transfer_to_<agent> tool call followed by an agents.handoff span, and the destination agent’s work lands as a sibling under the same parent task. Open the trace in tree view to see the full structure.Sub-agents invoked via as_tool / asTool look flat
Sub-agents invoked via as_tool / asTool look flat
Make sure the sub-agent is registered in the orchestrator’s
tools array via .as_tool(...) / .asTool(...), not re-exported as a plain function. Each as_tool call produces a FunctionTool whose execute spins up a nested Runner run; Laminar nests the inner run under the parent tool-call span only when the wrapper is the one invoked.Self-hosting Laminar
Self-hosting Laminar
Set
base_url and the ports of your instance when initializing. For a local OSS deployment:What’s next
Viewing traces
Read the transcript view, filter, and search across traces.
Signals
Detect behaviors and failures across every run, then query, cluster, and alert on them.
SQL editor and MCP server
Query traces programmatically from the UI, API, or your IDE.
Tracing structure
Sessions, metadata, and tags for deeper control.