> ## Documentation Index
> Fetch the complete documentation index at: https://laminarai-docs-lam-1778-self-host-access-control.mintlify.site/llms.txt
> Use this file to discover all available pages before exploring further.
# How the Debugger Runs
This is the loop your coding agent runs for you. With the [Laminar skill](https://github.com/lmnr-ai/lmnr-skills) installed, Claude Code, Cursor, or Codex drives every step below on its own: it records a run, names and annotates the session, inspects the traces with SQL, and replays from a checkpoint to iterate fast. Each step is also a plain CLI command or environment variable, so you can run any step by hand or take over at any point. Make sure you've completed [setup](/debugger/setup) first.
## See your agent runs in browser
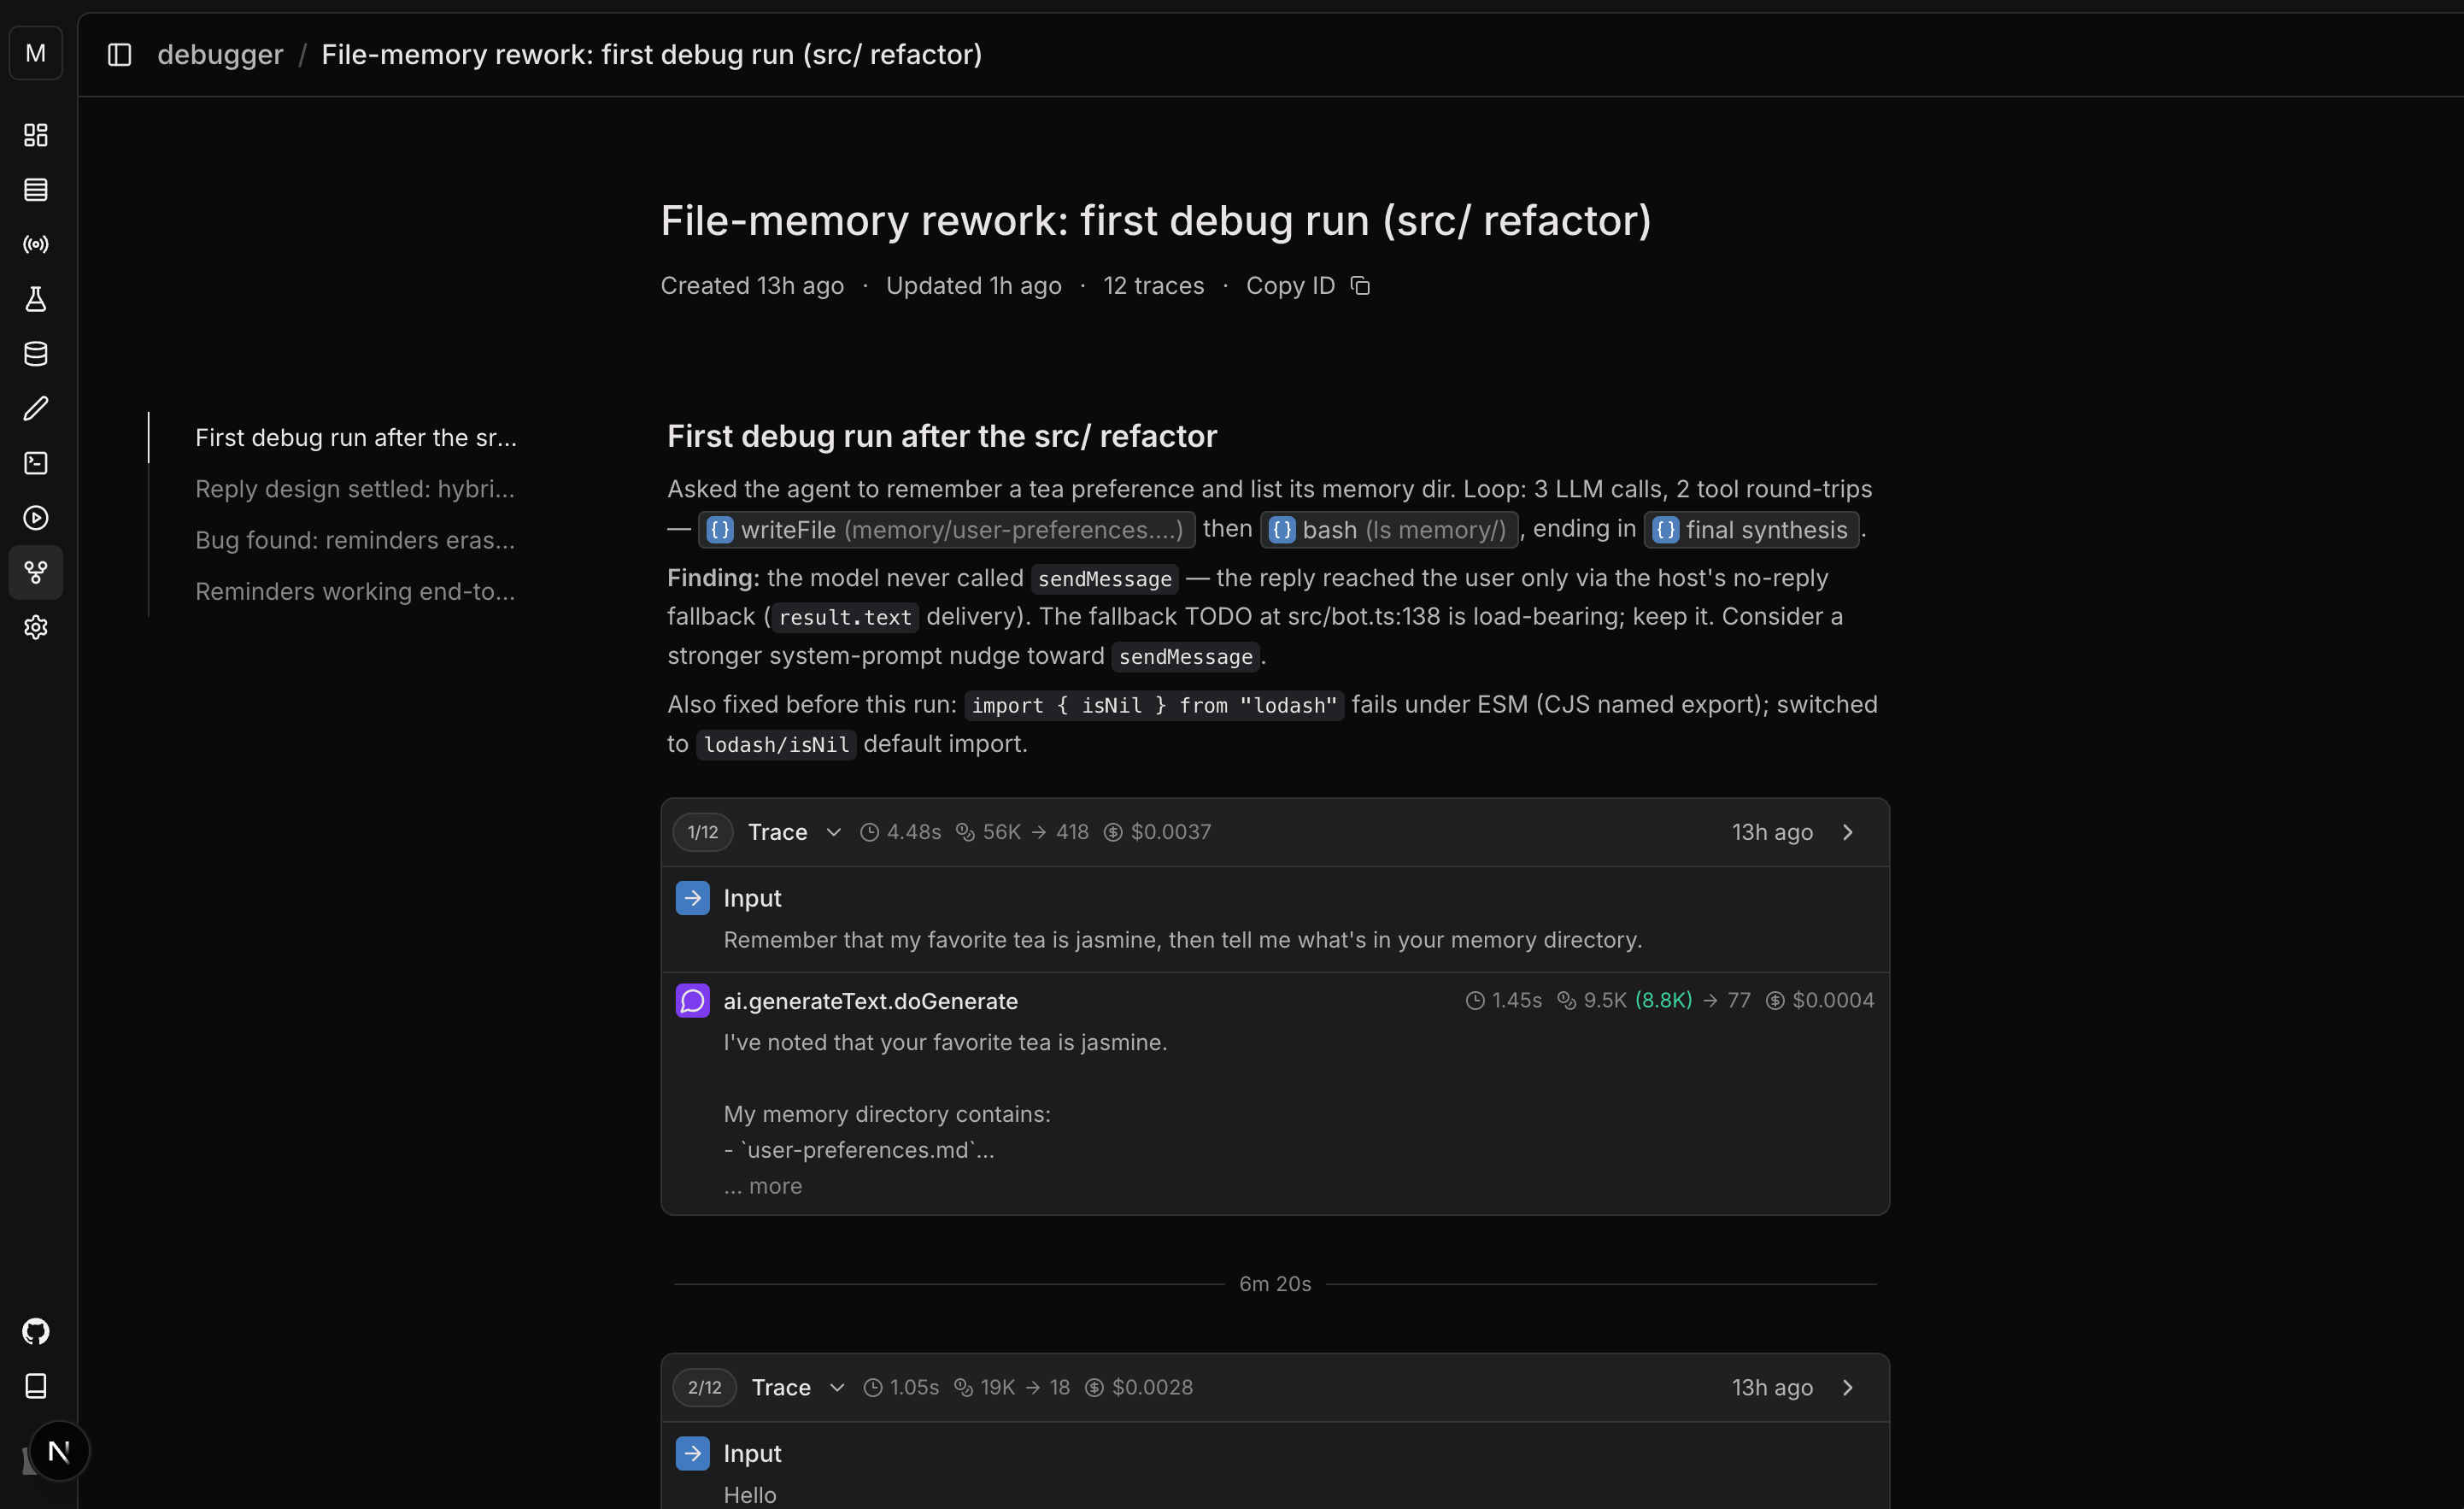
Watch your agent work from the Laminar UI while it drives the loop from the terminal. Open **Debugger** in your project and select the session, or click the `debugger_url` the SDK prints (it opens automatically when a debug run starts).
The session view streams every debug run as your coding agent works. Each segment renders Laminar's auto-extracted user inputs, LLM turns, tool calls, and collapsed sub-agent cards. Notes the agent attaches via `lmnr-cli trace append-note` (more on this below) render as markdown above each run's transcript, so you can follow its reasoning in real time.
 ## 1. Record a run
Add `LMNR_DEBUG=true` to your agent's run command:
```bash theme={null}
LMNR_DEBUG=true npx tsx my_agent.ts 2>&1 | tee run.log
grep 'LMNR_DEBUG_RUN' run.log
```
```bash theme={null}
LMNR_DEBUG=true python my_agent.py 2>&1 | tee run.log
grep 'LMNR_DEBUG_RUN' run.log
```
On startup the SDK registers a new debug session with Laminar, logs the session's `debugger_url`, opens it in your browser, and writes `.lmnr/debug-session.json` in the working directory. When the run finishes, the SDK prints a `LMNR_DEBUG_RUN` line with the run's ids. Always pipe stdout/stderr and grep for it explicitly, since other output will drown it.
The JSON on that line looks like:
```json theme={null}
{
"session_id": "…",
"trace_id": "…",
"replay_trace_id": null,
"cache_until": null,
"debugger_url": "https://laminar.sh/project//debugger-sessions/",
"started_at": "…"
}
```
You don't need to copy any of these ids. The same payload is saved to `.lmnr/debug-session.json`, and every later `LMNR_DEBUG=true` run in this directory reads that file and rejoins the same session automatically (no browser reopens). Your traces stay grouped without passing a session id around.
Continuation is not replay. Rejoining the session records another fresh run; it does not replay the previous trace. Replay is armed explicitly in [step 4](#4-replay-to-iterate-fast). To start a clean session instead of continuing, run `npx lmnr-cli debug session new`, which mints a new session and resets the file.
## 2. Name the session and annotate each run
Name the investigation so it's easy to find later. Click the session title in the session-view header and type a name inline, or set it from the CLI. The CLI commands below target the session in `.lmnr/debug-session.json` by default, so you don't pass a session id:
```bash theme={null}
npx lmnr-cli debug session set-name "Fix report length + search tool"
```
Write a note **before** each run to explain what you are about to test. Set it via `LMNR_TRACE_METADATA`:
```bash theme={null}
LMNR_DEBUG=true \
LMNR_TRACE_METADATA='{"rollout.note": "## What I am testing\nReplaying calls 1-3, running call 4 live with the new length cap.\n\n"}' \
npx tsx my_agent.ts 2>&1 | tee run.log
```
The run rejoins the session from `.lmnr/debug-session.json`, so no `LMNR_DEBUG_SESSION_ID` is needed.
The note appears in the session view above the run's transcript, so the human watching sees what you're testing before the trace arrives.
After the run completes, append a follow-up:
```bash theme={null}
npx lmnr-cli trace append-note "## What this run showed
Length cap is working (~180 words, was ~600). Next: check citations."
```
The note lands on the latest trace of the current debug session; pass `--trace-id ` to annotate a specific run. Notes are append-only: each call adds a paragraph to the existing note.
In notes, reference a specific span with an XML tag. The UI renders it as a clickable chip that opens that span:
```text theme={null}
```
Get the span id from the session view (hover the span row and click **Copy span ID**) or from a SQL query.
## 3. Inspect with SQL
Query the session's traces from the CLI:
```bash theme={null}
npx lmnr-cli sql query "
SELECT id AS trace_id, start_time, status, total_tokens
FROM traces
WHERE simpleJSONExtractString(metadata, 'rollout.session_id') = ''
ORDER BY start_time DESC
LIMIT 10"
```
Locate the bad span:
```bash theme={null}
npx lmnr-cli sql query "
SELECT span_id, name, span_type, start_time, status
FROM spans
WHERE trace_id = ''
ORDER BY start_time ASC"
```
`span_type` is `LLM`, `TOOL`, `DEFAULT`, or `CACHED` (a replayed call in a replay run). Find the LLM call **before** the buggy one; its `span_id` is the replay boundary you'll pass as `LMNR_DEBUG_CACHE_UNTIL`.
Run `npx lmnr-cli sql schema` to see all available tables.
## 4. Replay to iterate fast
After editing the agent, re-run with replay:
```bash theme={null}
LMNR_DEBUG=true \
LMNR_DEBUG_REPLAY_TRACE_ID= \
LMNR_DEBUG_CACHE_UNTIL= \
npx tsx my_agent.ts 2>&1 | tee run.log
grep 'LMNR_DEBUG_RUN' run.log
```
The run rejoins the session automatically, so you only set the replay variables. `LMNR_DEBUG_REPLAY_TRACE_ID` is the `trace_id` from the run you want to replay. `LMNR_DEBUG_CACHE_UNTIL` is the span id of the last LLM call to replay: the debugger serves cached responses through that call (inclusive) and runs live past it. Pass the id of the call **before** the buggy one, and the debugger runs your fix live while caching everything before it. See [how caching works](/debugger/caching) for the lookup mechanism.
Each replay produces a new trace in the same session, so attempts appear sequentially in the UI.
## 5. Re-orient with a session summary
After a context reset or to catch up on an ongoing session, dump all trace notes in order:
```bash theme={null}
npx lmnr-cli debug session summary
npx lmnr-cli debug session summary --json
```
This defaults to the current session; pass `--session-id ` for another. Output is one block per trace, oldest first: the markdown note followed by a `` tag you can feed into SQL queries.
## What's next
Read the full transcript view: inputs, LLM turns, tool calls, and sub-agent cards.
Query spans, traces, and signal events with ClickHouse SQL directly in the browser.
Full reference for `lmnr-cli sql`, `dataset`, `debug`, and `trace` commands.
End-to-end walkthrough debugging a Browser Use agent with the debugger.
## 1. Record a run
Add `LMNR_DEBUG=true` to your agent's run command:
```bash theme={null}
LMNR_DEBUG=true npx tsx my_agent.ts 2>&1 | tee run.log
grep 'LMNR_DEBUG_RUN' run.log
```
```bash theme={null}
LMNR_DEBUG=true python my_agent.py 2>&1 | tee run.log
grep 'LMNR_DEBUG_RUN' run.log
```
On startup the SDK registers a new debug session with Laminar, logs the session's `debugger_url`, opens it in your browser, and writes `.lmnr/debug-session.json` in the working directory. When the run finishes, the SDK prints a `LMNR_DEBUG_RUN` line with the run's ids. Always pipe stdout/stderr and grep for it explicitly, since other output will drown it.
The JSON on that line looks like:
```json theme={null}
{
"session_id": "…",
"trace_id": "…",
"replay_trace_id": null,
"cache_until": null,
"debugger_url": "https://laminar.sh/project//debugger-sessions/",
"started_at": "…"
}
```
You don't need to copy any of these ids. The same payload is saved to `.lmnr/debug-session.json`, and every later `LMNR_DEBUG=true` run in this directory reads that file and rejoins the same session automatically (no browser reopens). Your traces stay grouped without passing a session id around.
Continuation is not replay. Rejoining the session records another fresh run; it does not replay the previous trace. Replay is armed explicitly in [step 4](#4-replay-to-iterate-fast). To start a clean session instead of continuing, run `npx lmnr-cli debug session new`, which mints a new session and resets the file.
## 2. Name the session and annotate each run
Name the investigation so it's easy to find later. Click the session title in the session-view header and type a name inline, or set it from the CLI. The CLI commands below target the session in `.lmnr/debug-session.json` by default, so you don't pass a session id:
```bash theme={null}
npx lmnr-cli debug session set-name "Fix report length + search tool"
```
Write a note **before** each run to explain what you are about to test. Set it via `LMNR_TRACE_METADATA`:
```bash theme={null}
LMNR_DEBUG=true \
LMNR_TRACE_METADATA='{"rollout.note": "## What I am testing\nReplaying calls 1-3, running call 4 live with the new length cap.\n\n"}' \
npx tsx my_agent.ts 2>&1 | tee run.log
```
The run rejoins the session from `.lmnr/debug-session.json`, so no `LMNR_DEBUG_SESSION_ID` is needed.
The note appears in the session view above the run's transcript, so the human watching sees what you're testing before the trace arrives.
After the run completes, append a follow-up:
```bash theme={null}
npx lmnr-cli trace append-note "## What this run showed
Length cap is working (~180 words, was ~600). Next: check citations."
```
The note lands on the latest trace of the current debug session; pass `--trace-id ` to annotate a specific run. Notes are append-only: each call adds a paragraph to the existing note.
In notes, reference a specific span with an XML tag. The UI renders it as a clickable chip that opens that span:
```text theme={null}
```
Get the span id from the session view (hover the span row and click **Copy span ID**) or from a SQL query.
## 3. Inspect with SQL
Query the session's traces from the CLI:
```bash theme={null}
npx lmnr-cli sql query "
SELECT id AS trace_id, start_time, status, total_tokens
FROM traces
WHERE simpleJSONExtractString(metadata, 'rollout.session_id') = ''
ORDER BY start_time DESC
LIMIT 10"
```
Locate the bad span:
```bash theme={null}
npx lmnr-cli sql query "
SELECT span_id, name, span_type, start_time, status
FROM spans
WHERE trace_id = ''
ORDER BY start_time ASC"
```
`span_type` is `LLM`, `TOOL`, `DEFAULT`, or `CACHED` (a replayed call in a replay run). Find the LLM call **before** the buggy one; its `span_id` is the replay boundary you'll pass as `LMNR_DEBUG_CACHE_UNTIL`.
Run `npx lmnr-cli sql schema` to see all available tables.
## 4. Replay to iterate fast
After editing the agent, re-run with replay:
```bash theme={null}
LMNR_DEBUG=true \
LMNR_DEBUG_REPLAY_TRACE_ID= \
LMNR_DEBUG_CACHE_UNTIL= \
npx tsx my_agent.ts 2>&1 | tee run.log
grep 'LMNR_DEBUG_RUN' run.log
```
The run rejoins the session automatically, so you only set the replay variables. `LMNR_DEBUG_REPLAY_TRACE_ID` is the `trace_id` from the run you want to replay. `LMNR_DEBUG_CACHE_UNTIL` is the span id of the last LLM call to replay: the debugger serves cached responses through that call (inclusive) and runs live past it. Pass the id of the call **before** the buggy one, and the debugger runs your fix live while caching everything before it. See [how caching works](/debugger/caching) for the lookup mechanism.
Each replay produces a new trace in the same session, so attempts appear sequentially in the UI.
## 5. Re-orient with a session summary
After a context reset or to catch up on an ongoing session, dump all trace notes in order:
```bash theme={null}
npx lmnr-cli debug session summary
npx lmnr-cli debug session summary --json
```
This defaults to the current session; pass `--session-id ` for another. Output is one block per trace, oldest first: the markdown note followed by a `` tag you can feed into SQL queries.
## What's next
Read the full transcript view: inputs, LLM turns, tool calls, and sub-agent cards.
Query spans, traces, and signal events with ClickHouse SQL directly in the browser.
Full reference for `lmnr-cli sql`, `dataset`, `debug`, and `trace` commands.
End-to-end walkthrough debugging a Browser Use agent with the debugger.